

Plot ECG and respiration from Aidlab 2 on a shared timeline with the Python SDK and matplotlib. Save samples to CSV and the final plot to PNG.
Plot ECG and respiration from Aidlab 2 on a shared timeline, then save the samples to CSV. This Python example uses the Aidlab SDK and matplotlib to show the latest ten seconds of both signals.
What you need
Use Aidlab 2, Python 3.10 or newer, and a computer with Bluetooth 4.0+ and a matplotlib backend that can open a window, such as TkAgg or QtAgg. Aidlab is the first-generation device; Aidmed One is a separate product. Check each model's signals and sampling rates before adapting the example.
Create and activate a virtual environment as described in the Python installation guide, then install:
python -m pip install aidlabsdk==2.9.0 matplotlib
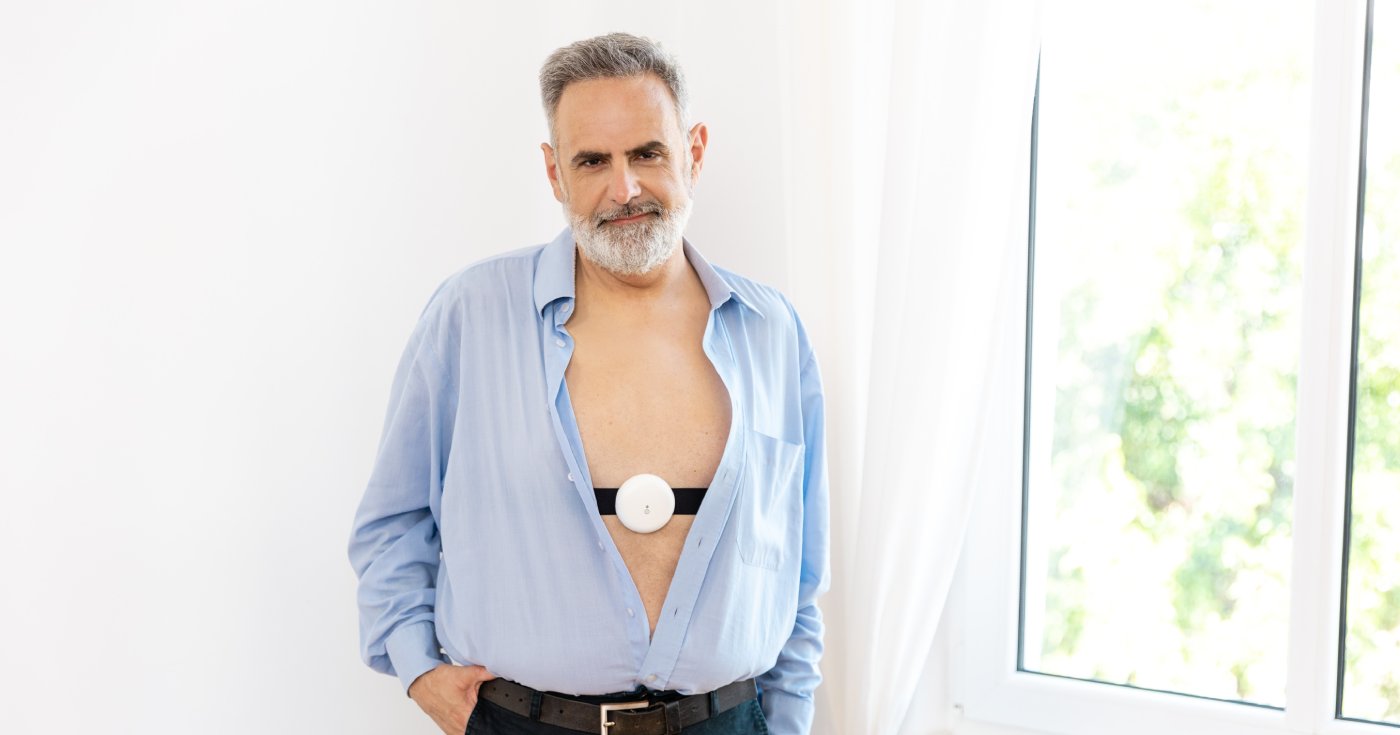
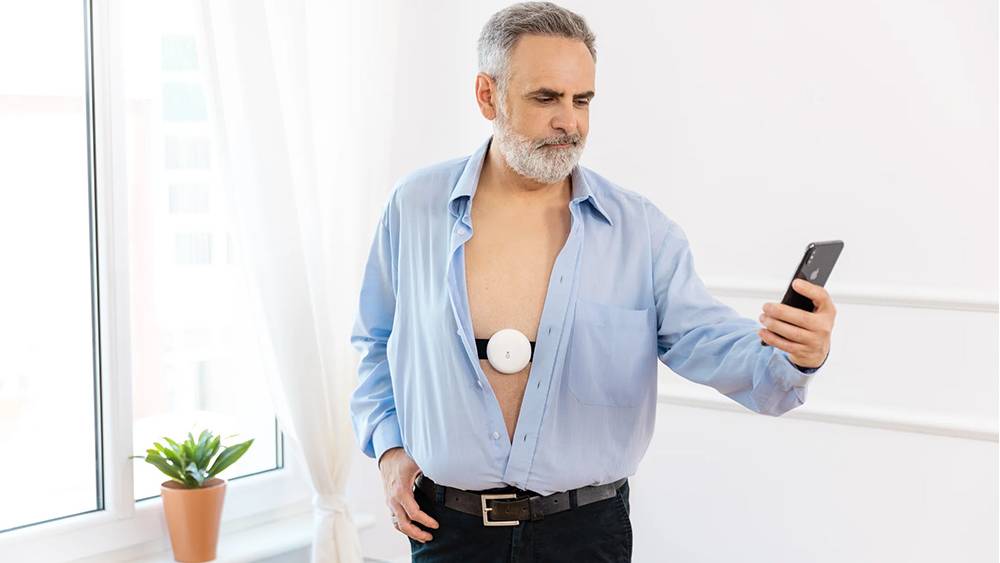
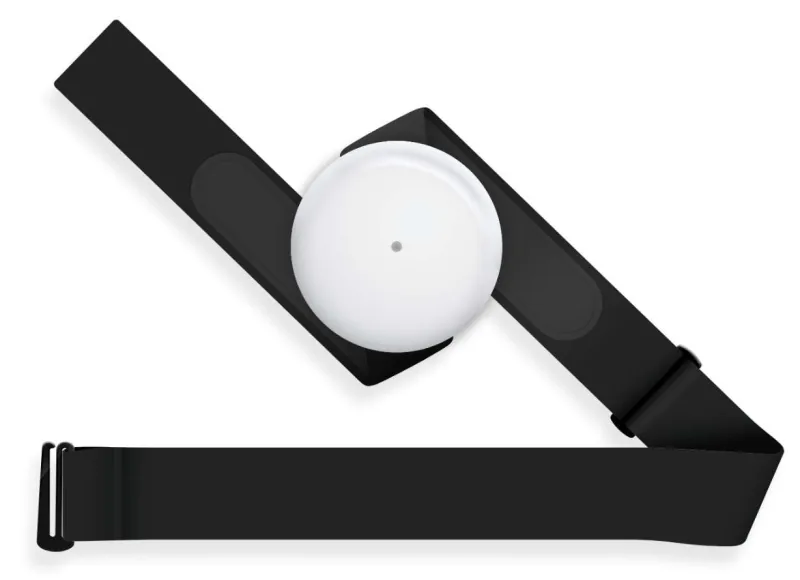
Wear the strap with its electrodes touching your skin. The device starts delivering measurement samples when it detects that it is worn. Close any other app connected to it before running the script.
What the signals mean
The ECG callback supplies values in volts; we multiply them by 1,000 only for the plot's millivolt scale. The respiration callback supplies a breathing waveform in ohms, reflecting changes in chest impedance. Its amplitude is not a calibrated volume of air in litres. For breaths per minute, select the separate DataType.RESPIRATION_RATE signal.
Both callbacks supply capture timestamps in milliseconds since the Unix epoch. Samples can arrive in batches, so the callback's arrival time is not the measurement time. Keep ECG and respiration as separate series and align them by timestamp, rather than pairing samples by their index. See data types and events for the callback and timing contract.
Live plot and CSV export
Save this code as respiration_plotting.py. It records for 30 seconds, or until you close the plot. The CSV keeps every received sample in its original unit; the PNG saves the final plot window.
We checked this example on Windows with Aidlab 2 firmware 4.0.3, Python 3.11, Aidlab SDK 2.9.0 and matplotlib 3.11.2. The device supplied a test ECG signal and a flat respiration channel. This verified streaming, the live plot and CSV/PNG export; it did not validate a breathing waveform recorded from a person.
import asyncio
import csv
import sys
from collections import deque
from datetime import datetime

import matplotlib.pyplot as plt
from aidlab import AidlabManager, BleakTransport, DataType, Device, DeviceDelegate


class Recorder(DeviceDelegate):
    def __init__(self, writer):
        self.writer = writer
        self.samples = {"ecg": deque(), "respiration": deque()}
        self.first_timestamp = None

    def add_sample(self, signal, timestamp, value):
        unit = "V" if signal == "ecg" else "ohm"
        self.writer.writerow([signal, timestamp, value, unit])
        if self.first_timestamp is None:
            self.first_timestamp = timestamp
        samples = self.samples[signal]
        samples.append((timestamp, value))
        while timestamp - samples[0][0] > 10_000:
            samples.popleft()

    def did_receive_ecg(self, device, timestamp, value):
        self.add_sample("ecg", timestamp, value)

    def did_receive_respiration(self, device, timestamp, value):
        self.add_sample("respiration", timestamp, value)

    def did_disconnect(self, device, reason):
        print("Disconnected:", reason)


def draw(recorder, axes, lines):
    if recorder.first_timestamp is None:
        return
    for axis, line, signal, scale in zip(
        axes, lines, ("ecg", "respiration"), (1000, 1)
    ):
        samples = recorder.samples[signal]
        line.set_data(
            [(ts - recorder.first_timestamp) / 1000 for ts, _ in samples],
            [value * scale for _, value in samples],
        )
        axis.relim()
        axis.autoscale_view(scalex=False)
    latest = max(samples[-1][0] for samples in recorder.samples.values() if samples)
    end = (latest - recorder.first_timestamp) / 1000
    axes[0].set_xlim(max(0, end - 10), max(1, end))


async def main():
    if len(sys.argv) == 1:
        devices = await AidlabManager().scan()
        if not devices:
            raise RuntimeError("No device found. Turn Aidlab on and check Bluetooth.")
        for device in devices:
            print(device.name, device.address)
        print('Run again: python respiration_plotting.py "DEVICE_ADDRESS"')
        return
    device = Device(address=sys.argv[1], transport=BleakTransport(sys.argv[1]))

    basename = f"signals-{datetime.now():%Y%m%d-%H%M%S-%f}"
    plt.ion()
    figure, axes = plt.subplots(2, 1, sharex=True, layout="constrained")
    lines = [axis.plot([], [])[0] for axis in axes]
    axes[0].set_ylabel("ECG (mV)")
    axes[1].set_ylabel("Respiration (ohm)")
    axes[1].set_xlabel("Time since first sample (s)")
    plt.show(block=False)

    with open(f"{basename}.csv", "x", newline="") as output:
        writer = csv.writer(output)
        writer.writerow(["signal", "timestamp_ms", "value", "unit"])
        recorder = Recorder(writer)
        try:
            await device.connect(recorder)
            print("Connected:", device.name, device.address, device.firmware_revision)
            await device.collect([DataType.ECG, DataType.RESPIRATION], [])
            deadline = asyncio.get_running_loop().time() + 30
            print("Recording for 30 seconds; close the plot to finish earlier.")
            while plt.fignum_exists(figure.number):
                if not device.is_connected:
                    raise RuntimeError("Connection lost; the CSV contains a partial session.")
                draw(recorder, axes, lines)
                output.flush()
                figure.canvas.draw_idle()
                figure.canvas.flush_events()
                if asyncio.get_running_loop().time() >= deadline:
                    break
                await asyncio.sleep(0.1)
            if not all(recorder.samples.values()):
                raise RuntimeError("Missing ECG or respiration. Check strap contact and try again.")
            draw(recorder, axes, lines)
            figure.savefig(f"{basename}.png")
        finally:
            await device.disconnect()
            plt.close(figure)

    print("Saved:", f"{basename}.csv", f"{basename}.png")


if __name__ == "__main__":
    asyncio.run(main())
Run it without an address first to list nearby devices:
python respiration_plotting.py
Copy your Aidlab 2 address from the list and run:
python respiration_plotting.py "DEVICE_ADDRESS"
The script only connects to the address you choose. Each run writes a new signals-<date>-<time>.csv and a matching PNG in the current directory. If either signal is missing, it reports an error; check the strap contact before trying again. A connection failure also reports an error and leaves the partial CSV available for inspection.
The top plot shows ECG in millivolts and the lower plot shows respiration in ohms. Both use the same time origin and x-axis. The plot refreshes about ten times a second; that controls display updates, not the device's sampling rate. We do not interpolate or resample either signal.

The breathing waveform illustrated in the original tutorial.
The CSV columns are signal (ecg or respiration), timestamp_ms (Unix milliseconds), value (the SDK value), and unit (V or ohm). Rows follow callback order, so the whole file need not be chronological. Split it by signal and sort by timestamp before further analysis.
Recording without a connected computer
The first list in collect selects live signals; the empty second list disables offline recording. To configure storage and retrieve recordings, follow the synchronization guide, including its firmware-specific behavior.
For another use of the breathing waveform, see reading respiration in Unity. For ECG-derived beat intervals, see why and how to measure HRV.