Create reports for team members using configurable data components and flexible layouts.
Key features
- Create reports for any team member
- Customize layout with drag-and-drop components
- Export as PDF, CSV or EDF for further analysis
- Save templates for repeated use
- Customize charts: axis titles, ranges, precision, and units
Creating reports
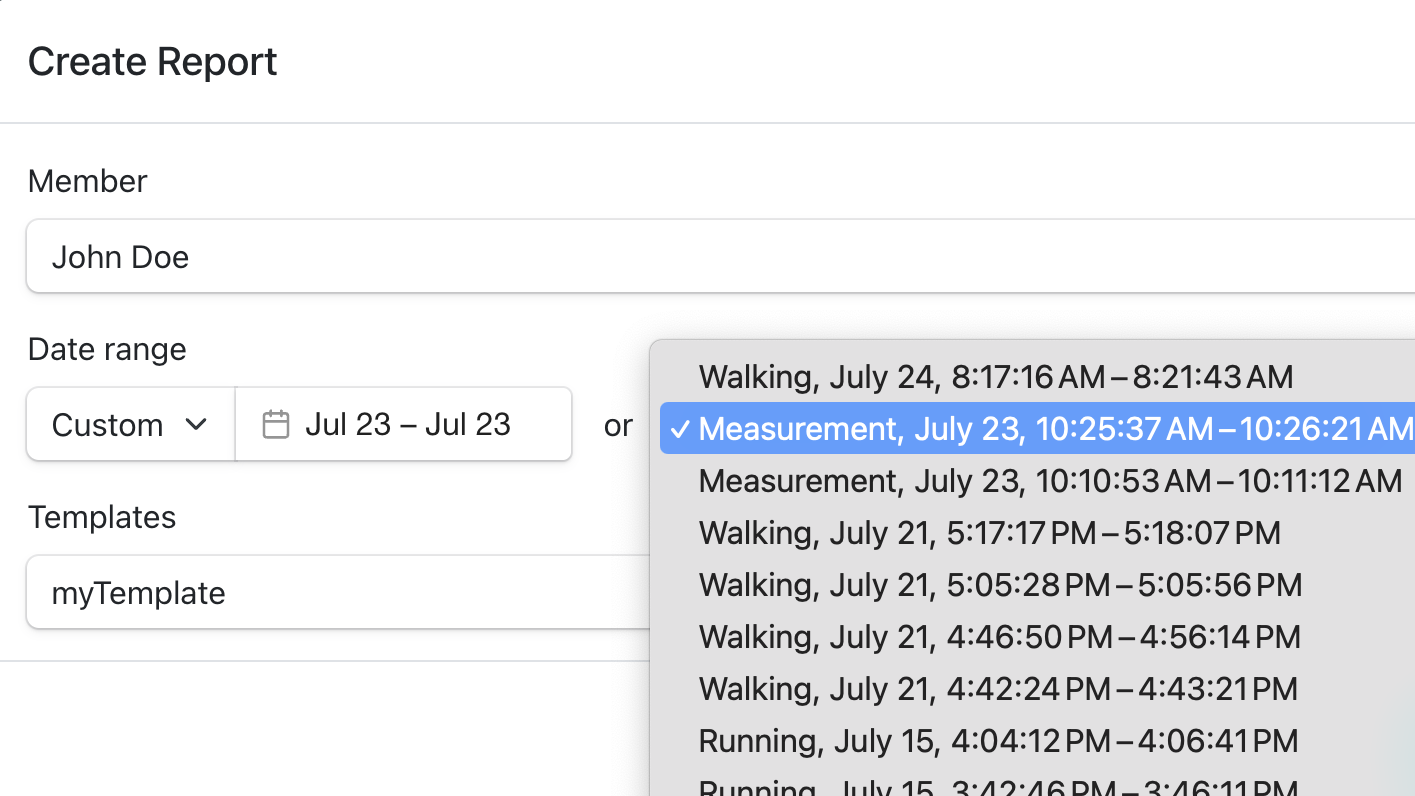
- Navigate to team dashboard → Reports → Create Report
- Select member from dropdown
- Choose date range (custom dates or existing measurement sessions)
- Apply template (optional) for pre-configured layouts
- Click Create
Customizing reports
Add components: click + Add Component → select Heart Rate, Respiration, Temperature, HRV, etc.
Edit mode: click Edit to:
- Move components (drag handle)
- Resize components (drag corners)
- Configure charts (titles, ranges, units)
- Remove unwanted components
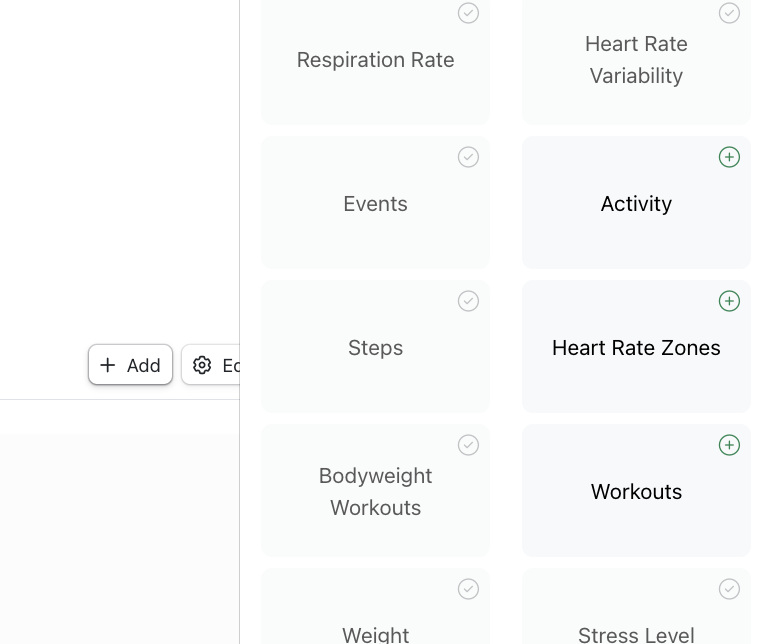
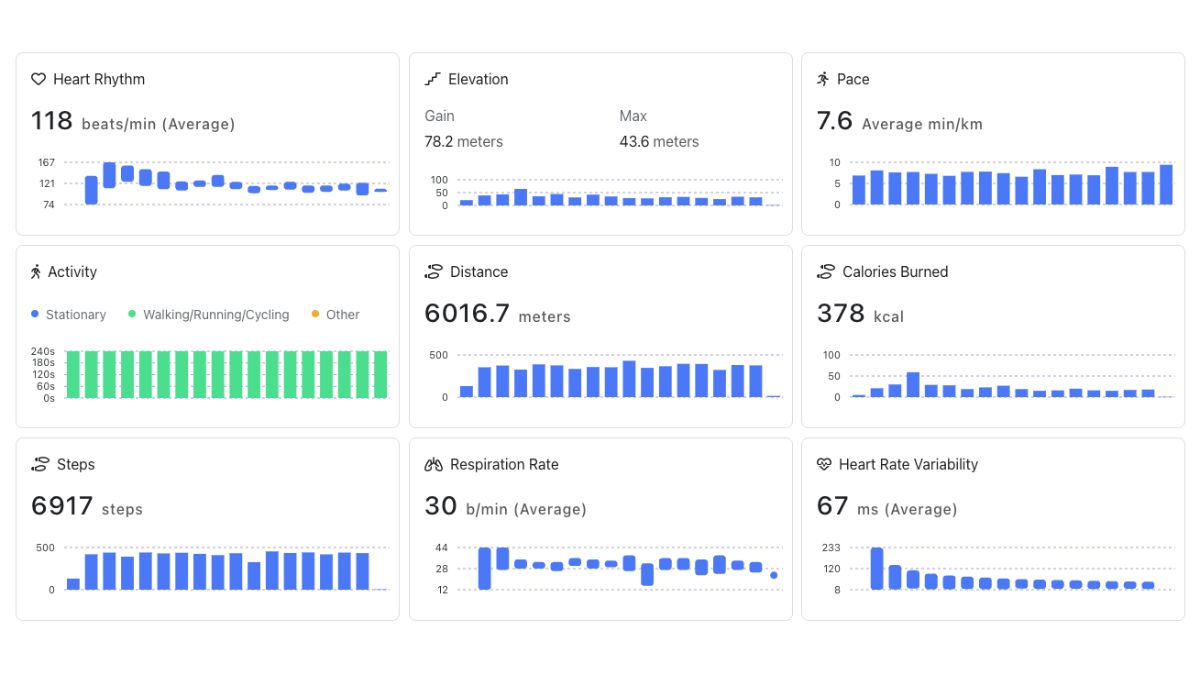
Chart customization: adjust axis titles, ranges, precision, and units to match your analysis.
Export Options
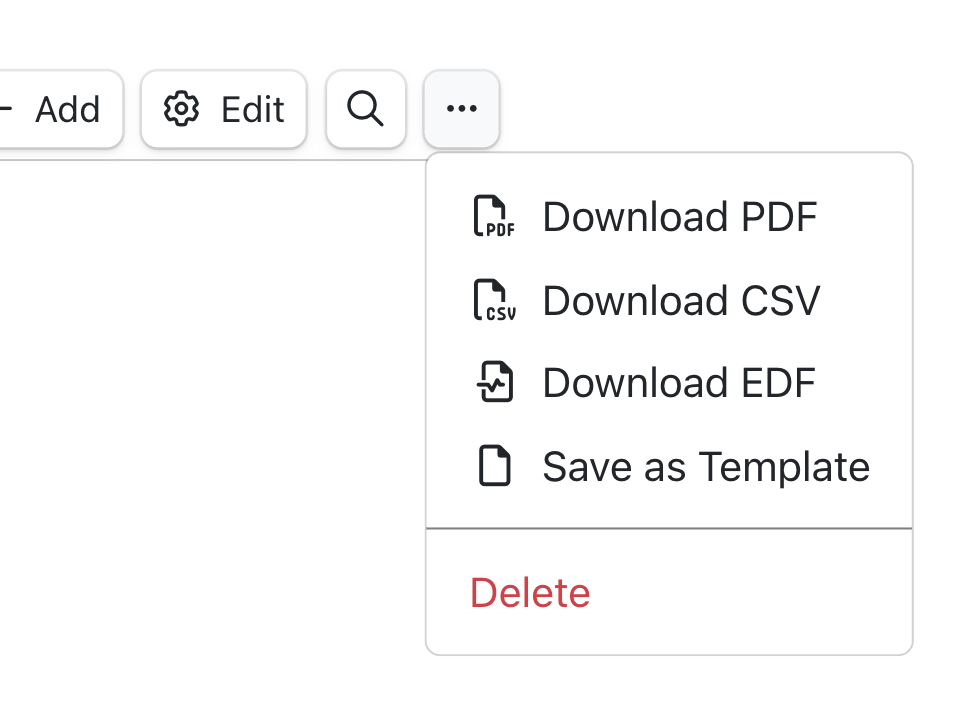
Click the menu (⋯) to:
- Download PDF: Generate formatted report
- Download CSV: Export raw data for analysis
- Download EDF: Export raw data in EDF format
- Save as Template: Reuse custom layouts
View reports: access reports from the main reports page, organized by member and date.
Delete reports: menu (⋯) → Delete → Confirm. Deleted reports cannot be recovered.
Need help? Contact support at contact@aidlab.com.