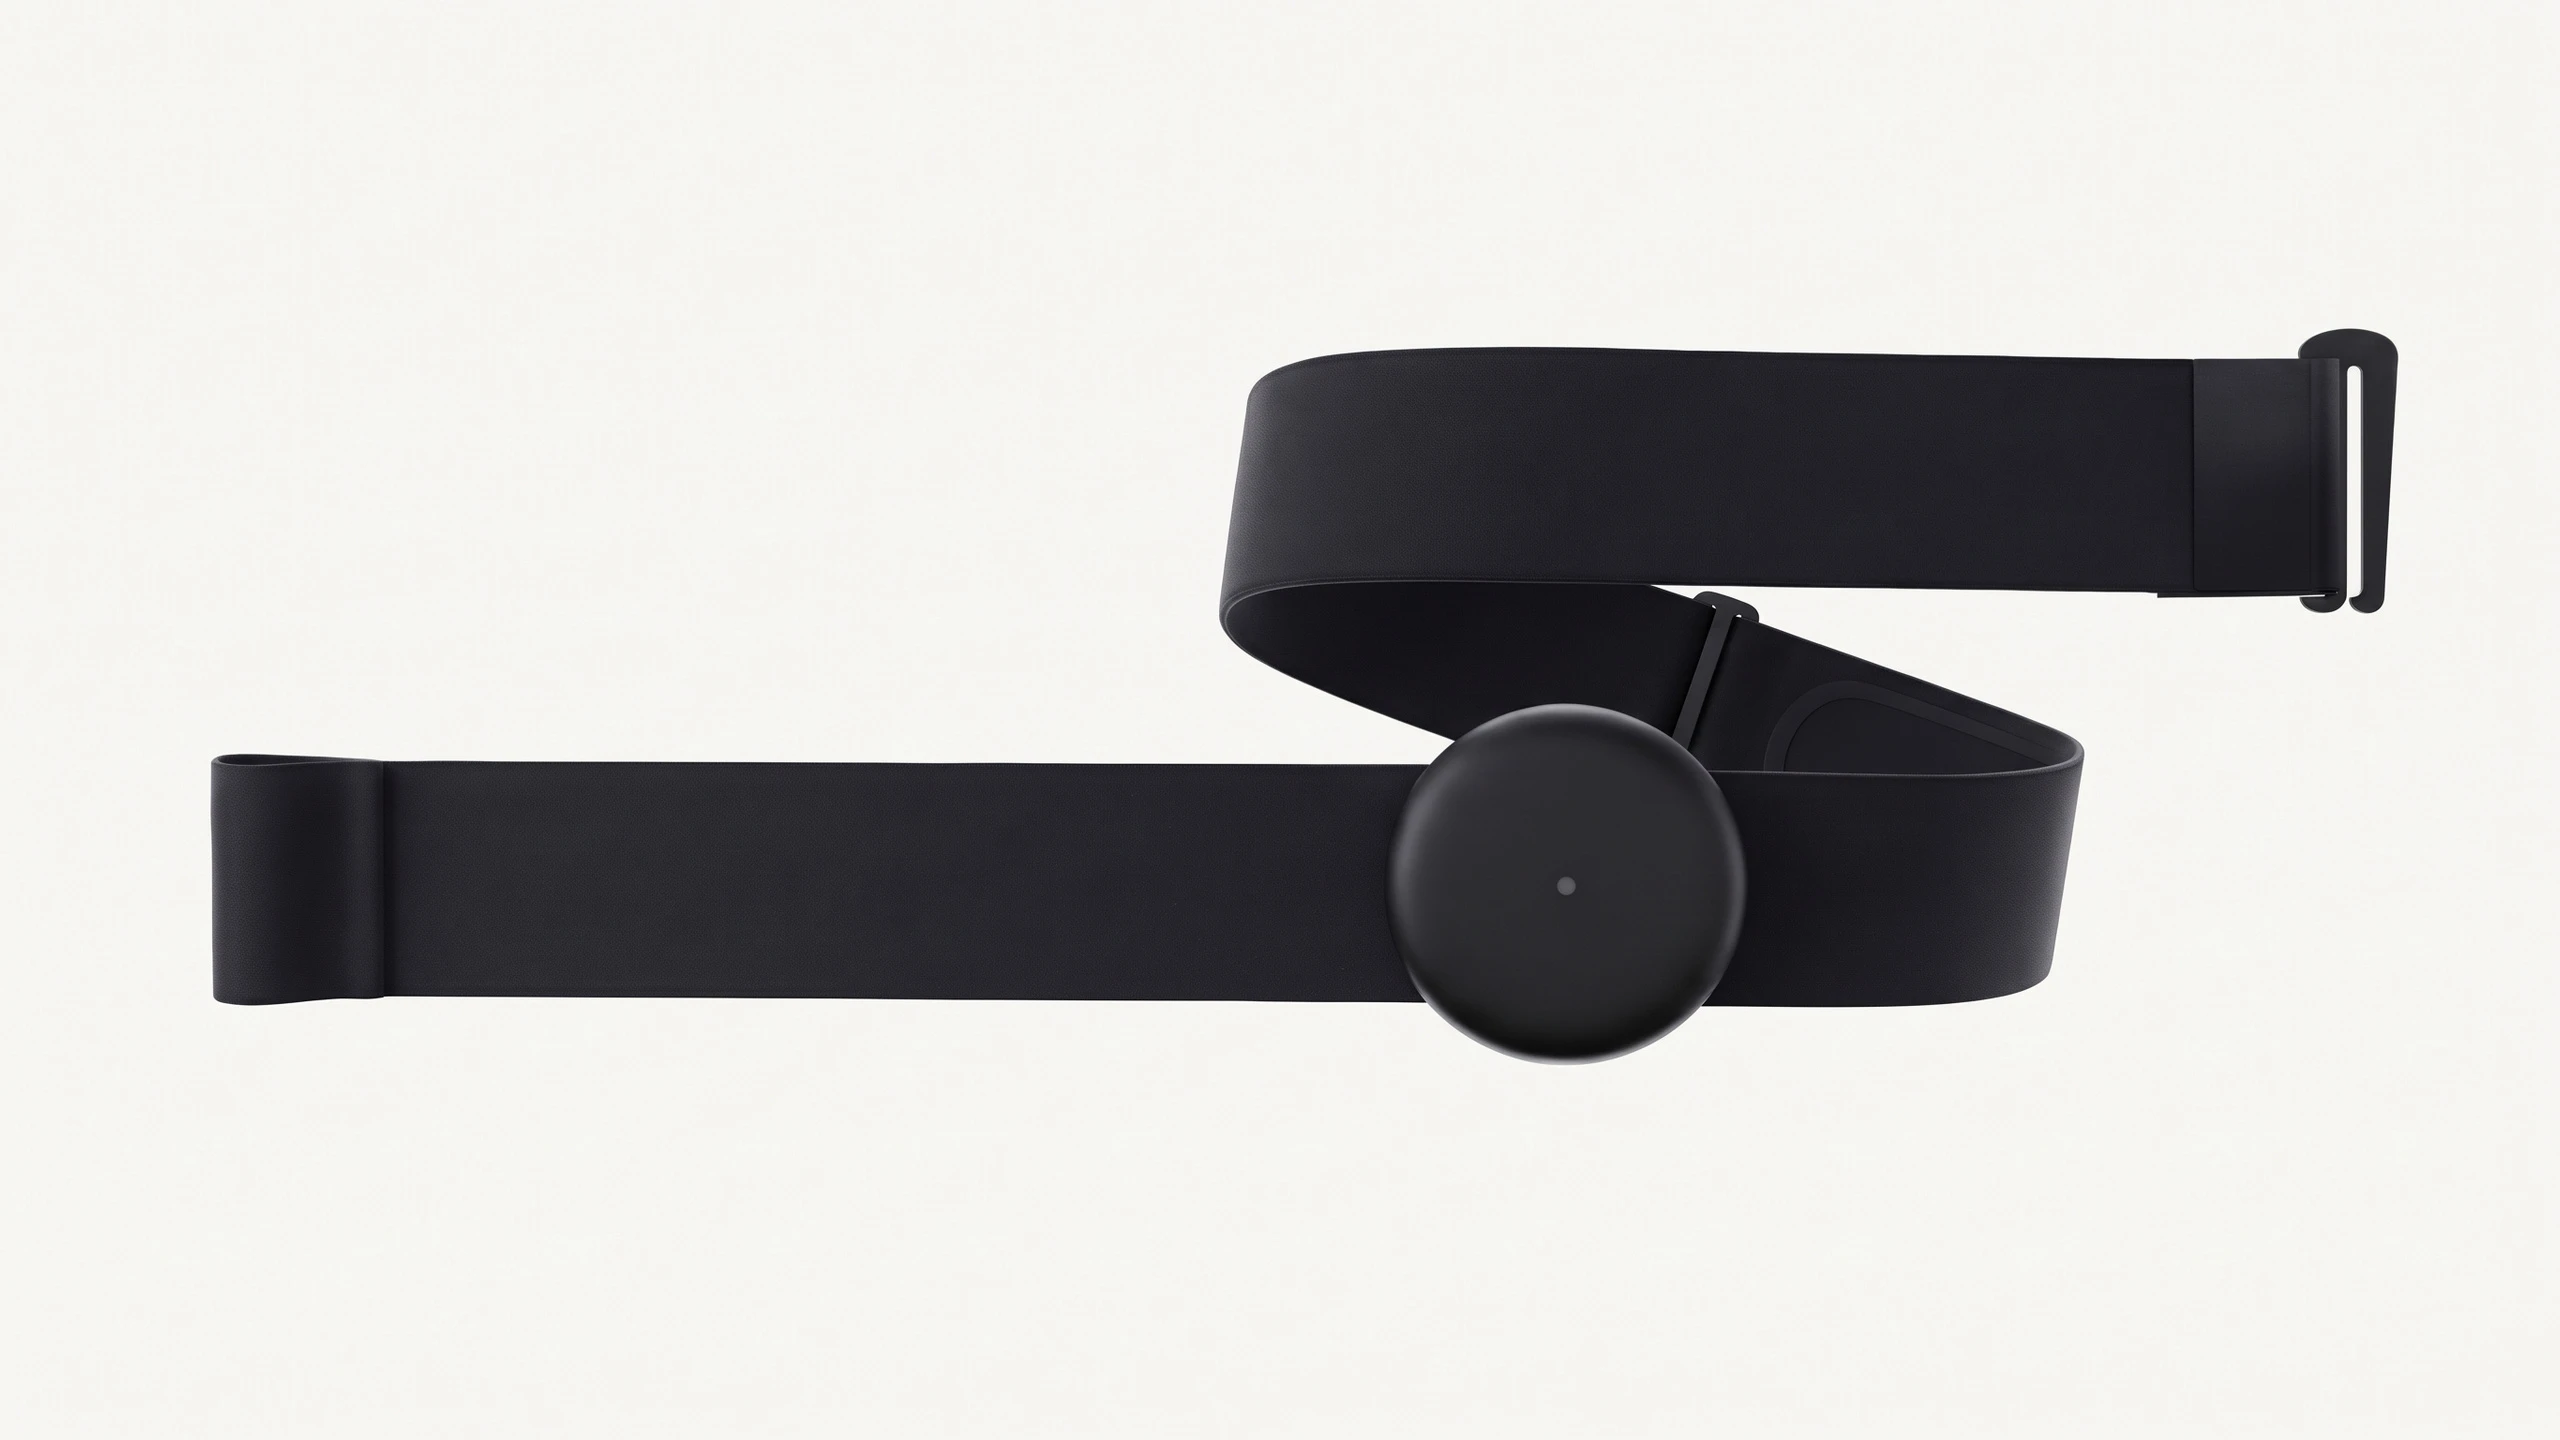
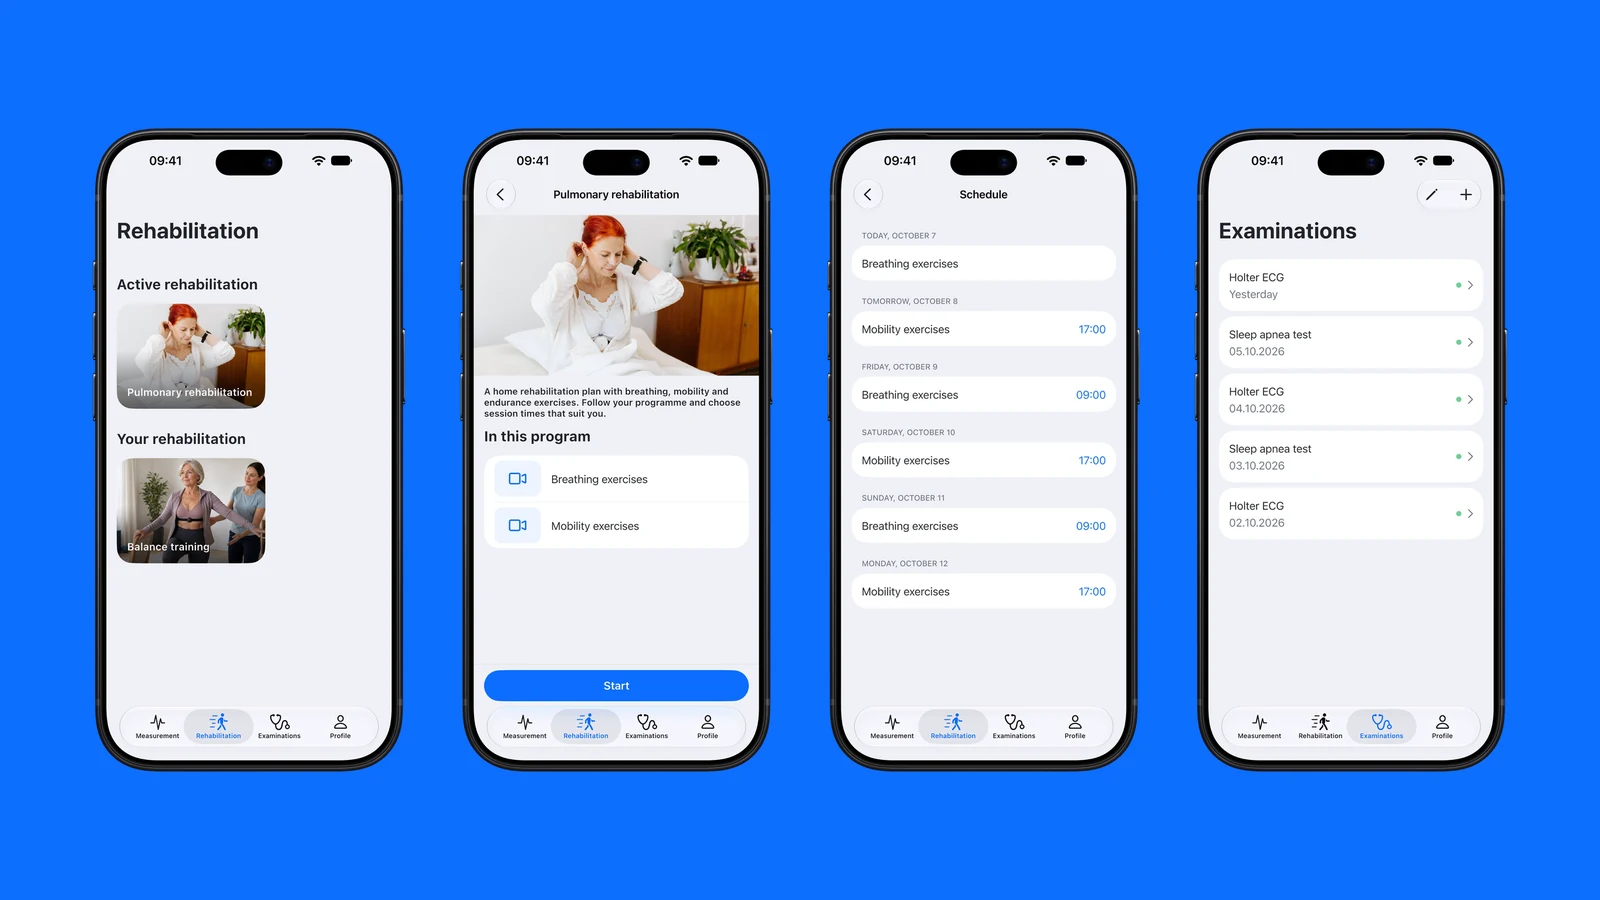
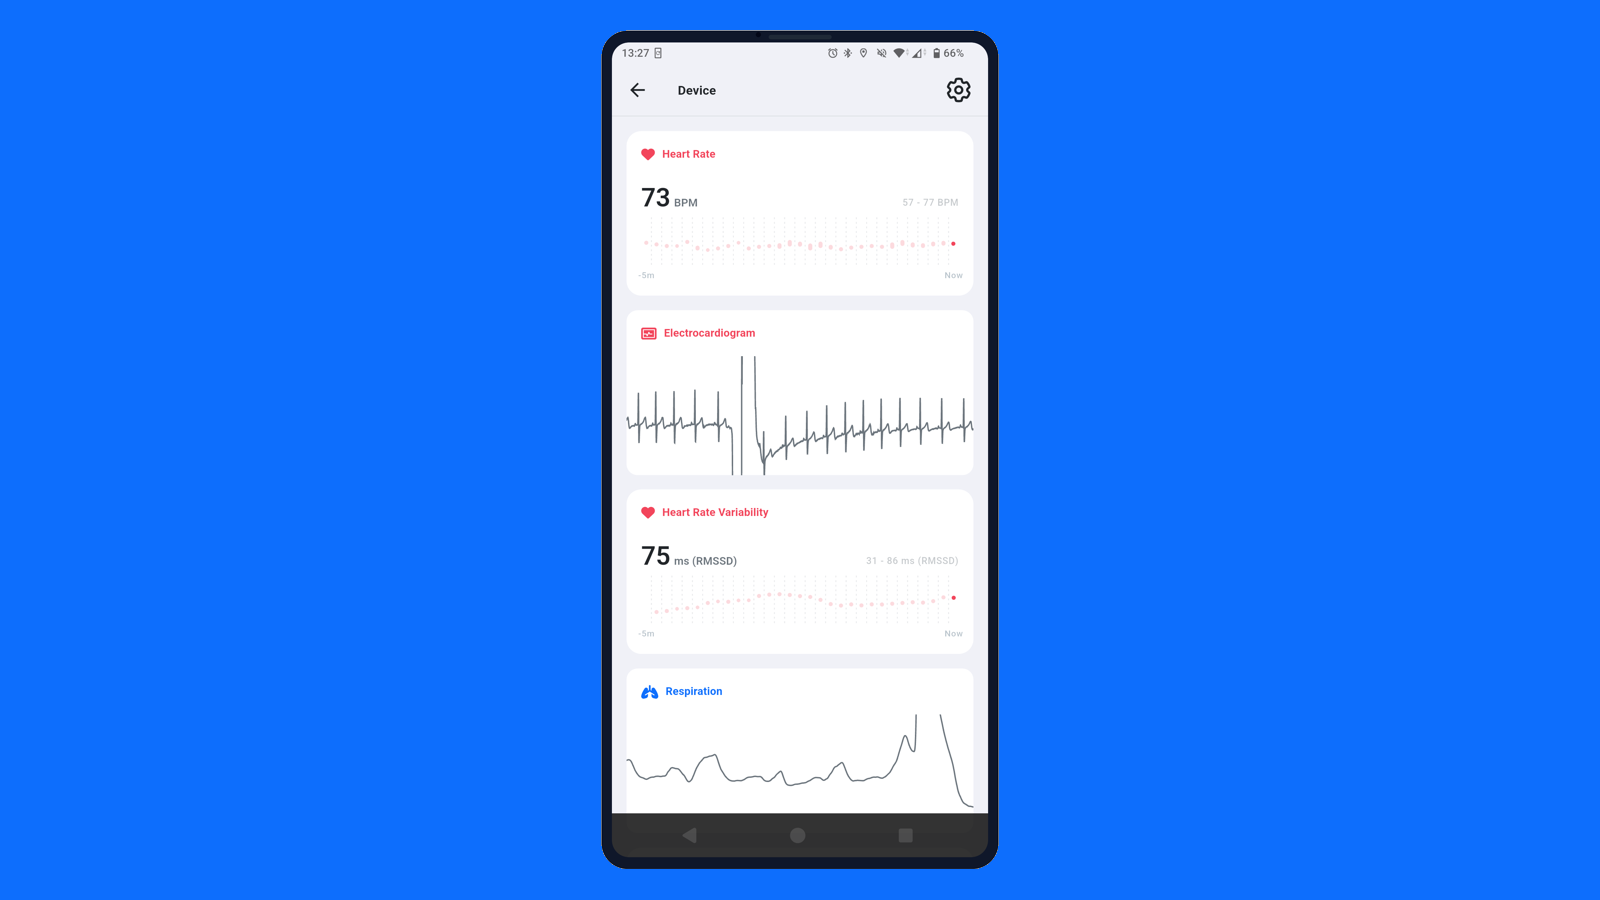
Over the past few years we've collected plenty of feedback on how to make Aidlab more convenient and more dependable. This time we optimized how Aidlab stores data and uses its battery, and made dozens of changes that make Aidlab more stable and sync smoother. We've also refreshed the foundations of Aidlab's system, so we can bring you new features faster. You can get the update in the official Aidlab or Aidmed Health app.
Aidmed
A new look for Aidmed Health
The patient app has a refreshed look on iPhone and Android. It's also simpler and asks even less of the patient: it guides them step by step, with even clearer instructions, through connecting Aidmed One and the overnight test, and if the connection drops, it resumes the measurement on its own. The app runs on iOS 16.2 or later and Android 12 or later.
Dashboard
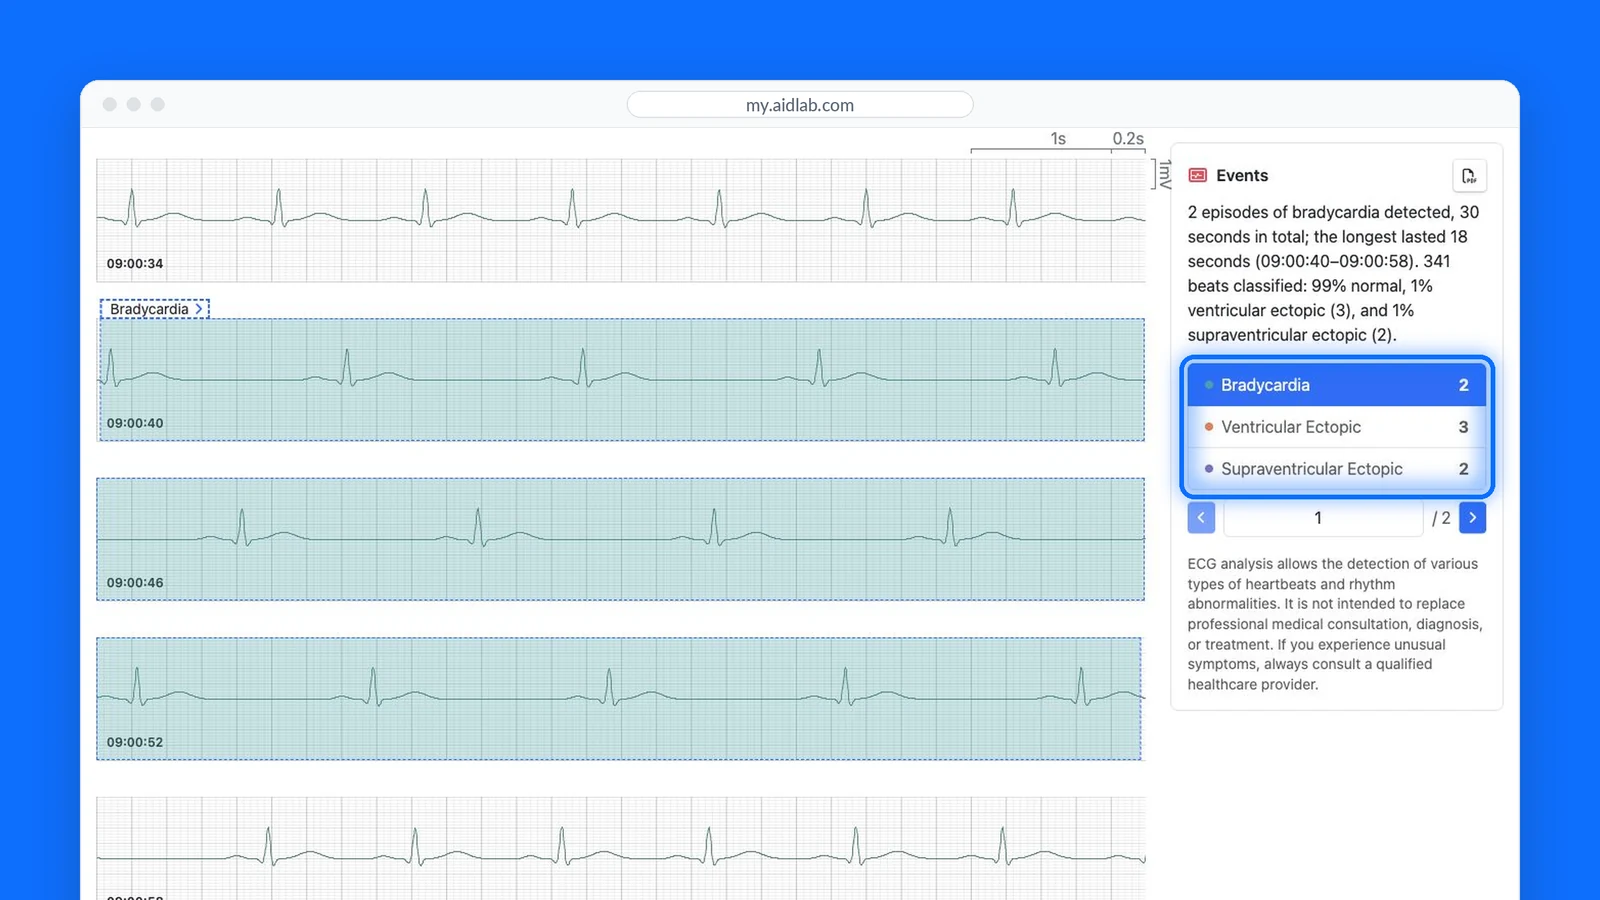
Find the ECG moment you want
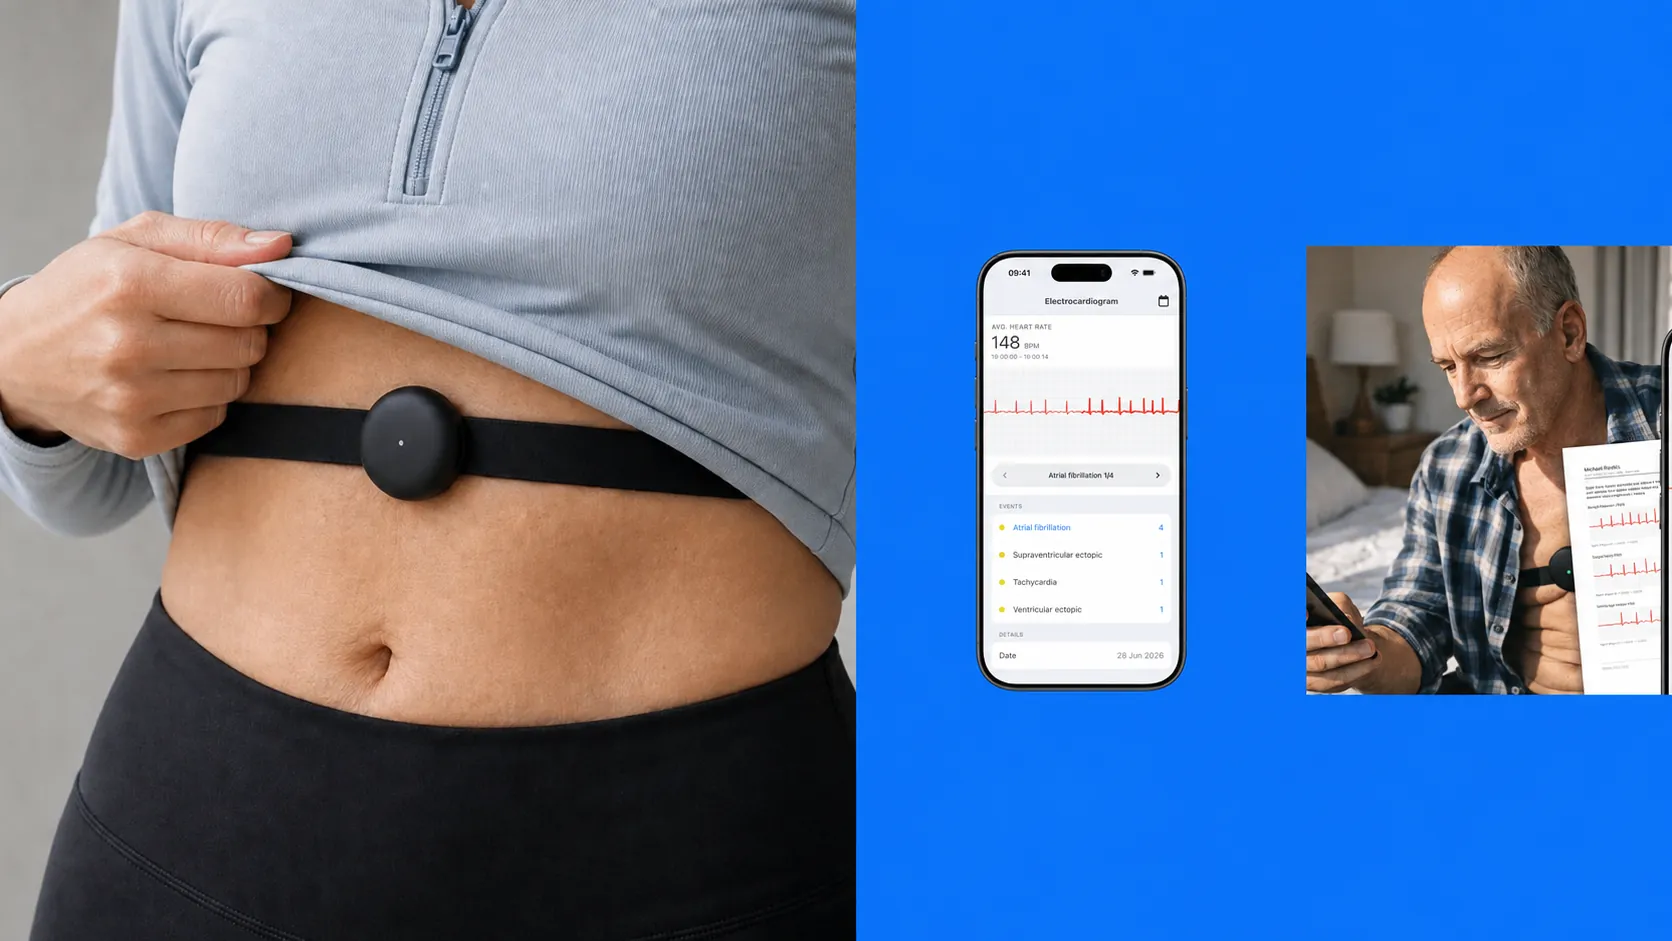
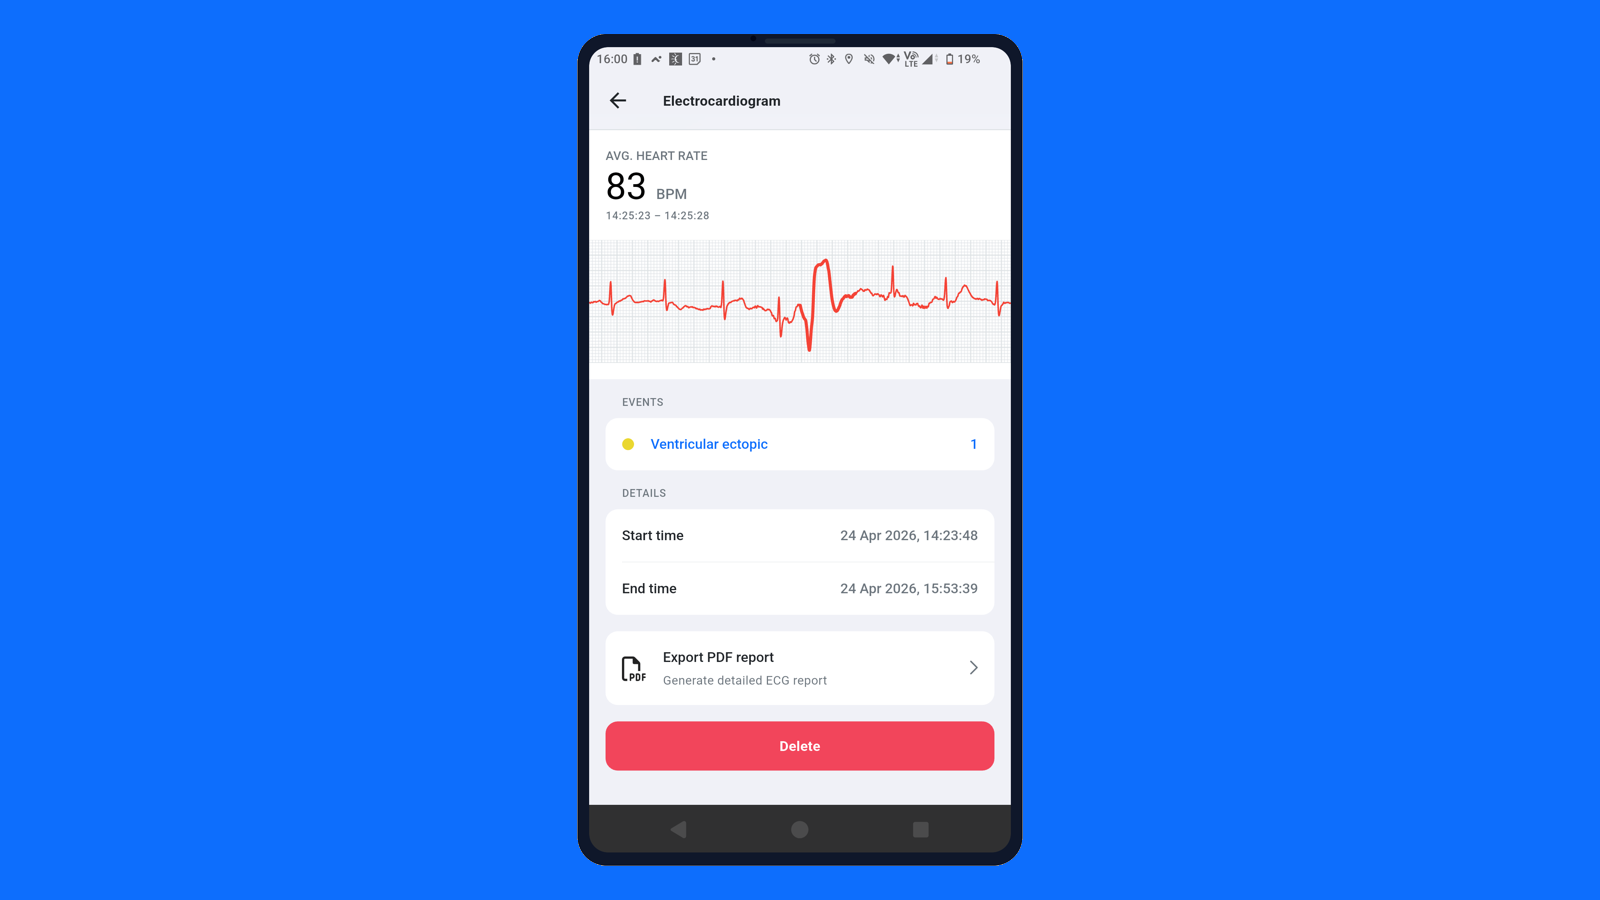
Select an ECG event on your dashboard to see that moment on the chart. Browse events by type and jump from one occurrence to the next. You can also save a PDF with the ECG strips you select.
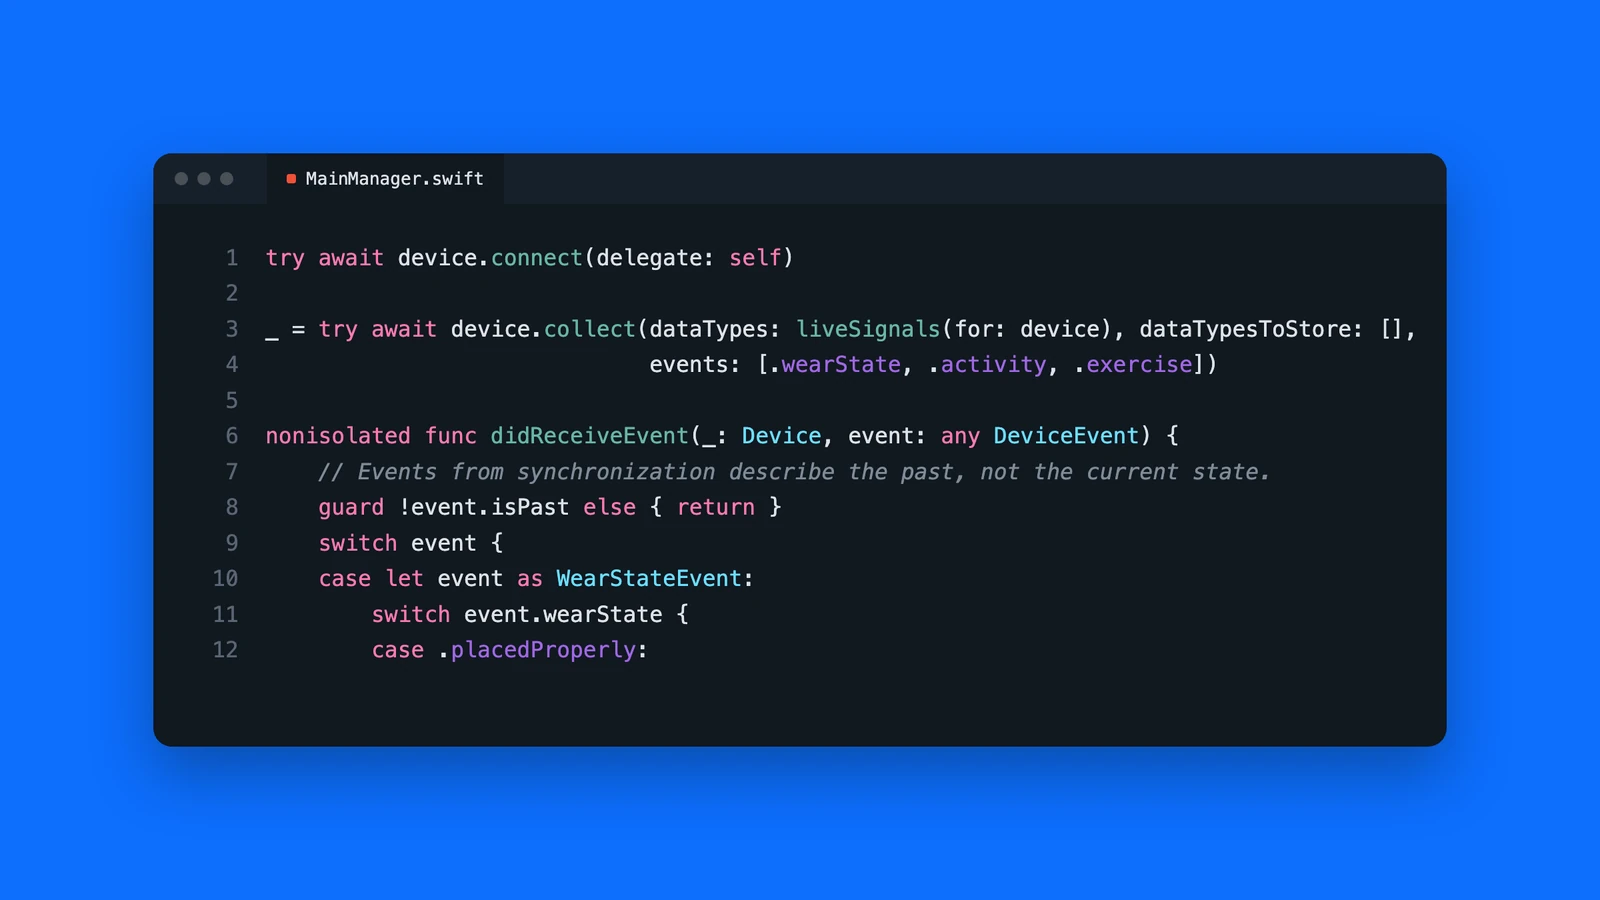
In October we shipped two major Aidlab SDK releases for Python, Flutter, Android, Apple platforms and Unity. The SDK now runs in Apple Watch apps and delivers every Aidlab event, including sleep stages, through a single callback. Integration is simpler too: a failed connection or a rejected command now raises a clear error, and on Android 12 and later you no longer need location permission. Update your code for the renamed callbacks when you upgrade.
Use Aidlab MCP to retrieve daily or hourly values, or look closer with individual samples. Daily summaries also include resting heart rate, respiration rate and weight when those data are available.
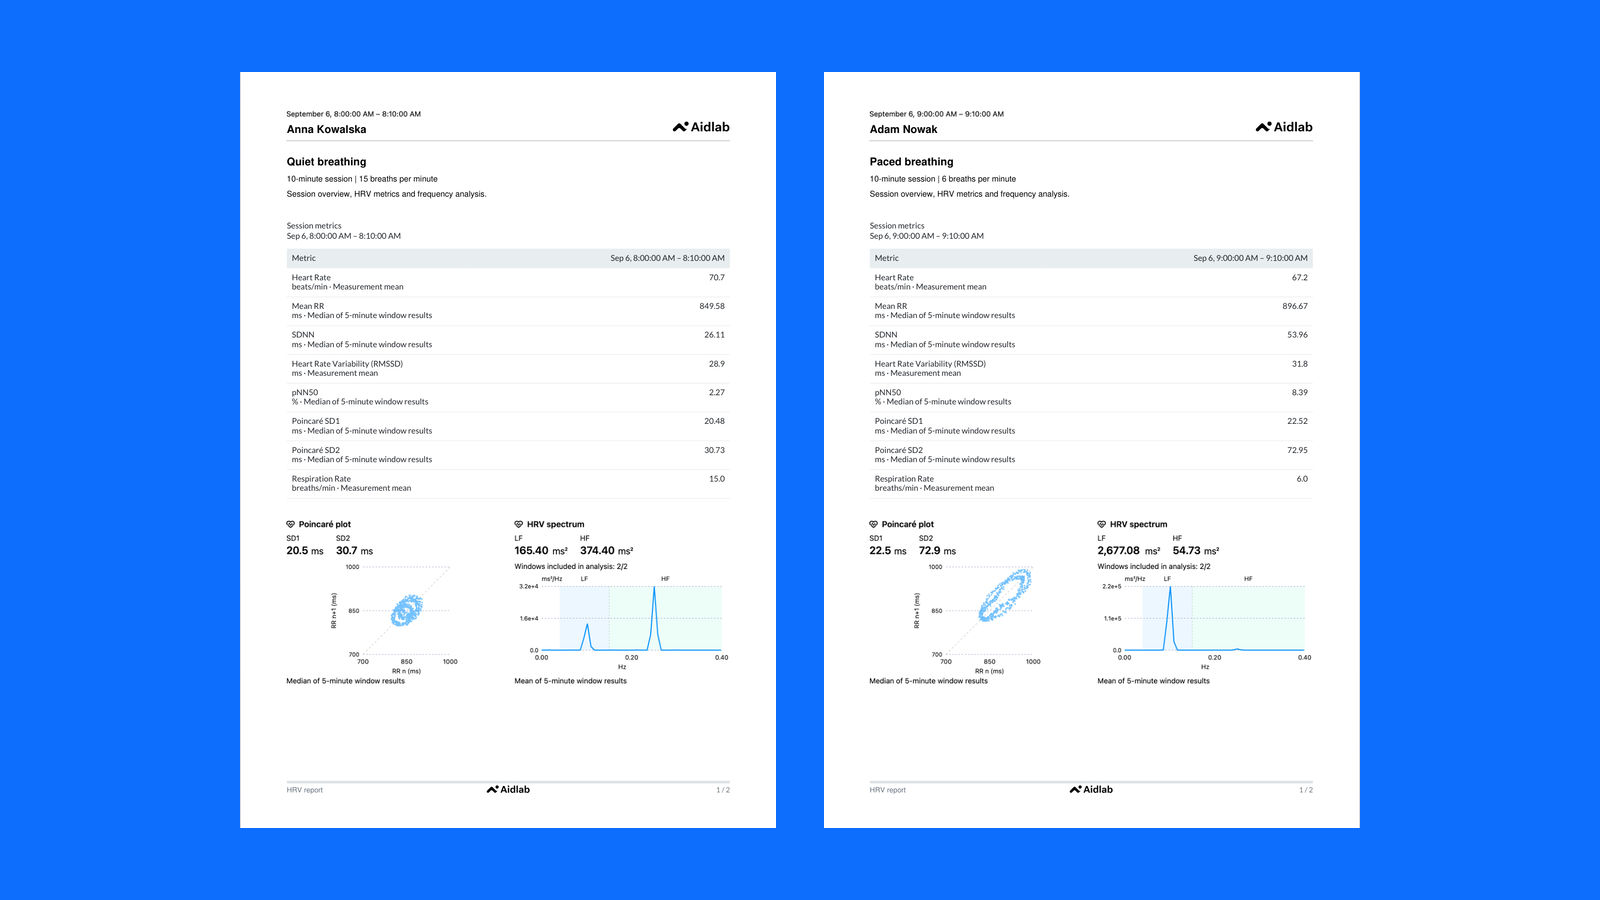
We've rebuilt reports around a cleaner two-column layout, giving charts and tables more room. Add metric tables, break results down by time period or session, and compare signals with the previous period. There are more ways to configure each report, including separate breakdown settings for PDF exports. For HRV work, teams on the Enterprise plan can add Poincaré plots and frequency analysis, or start with the new biofeedback program template.
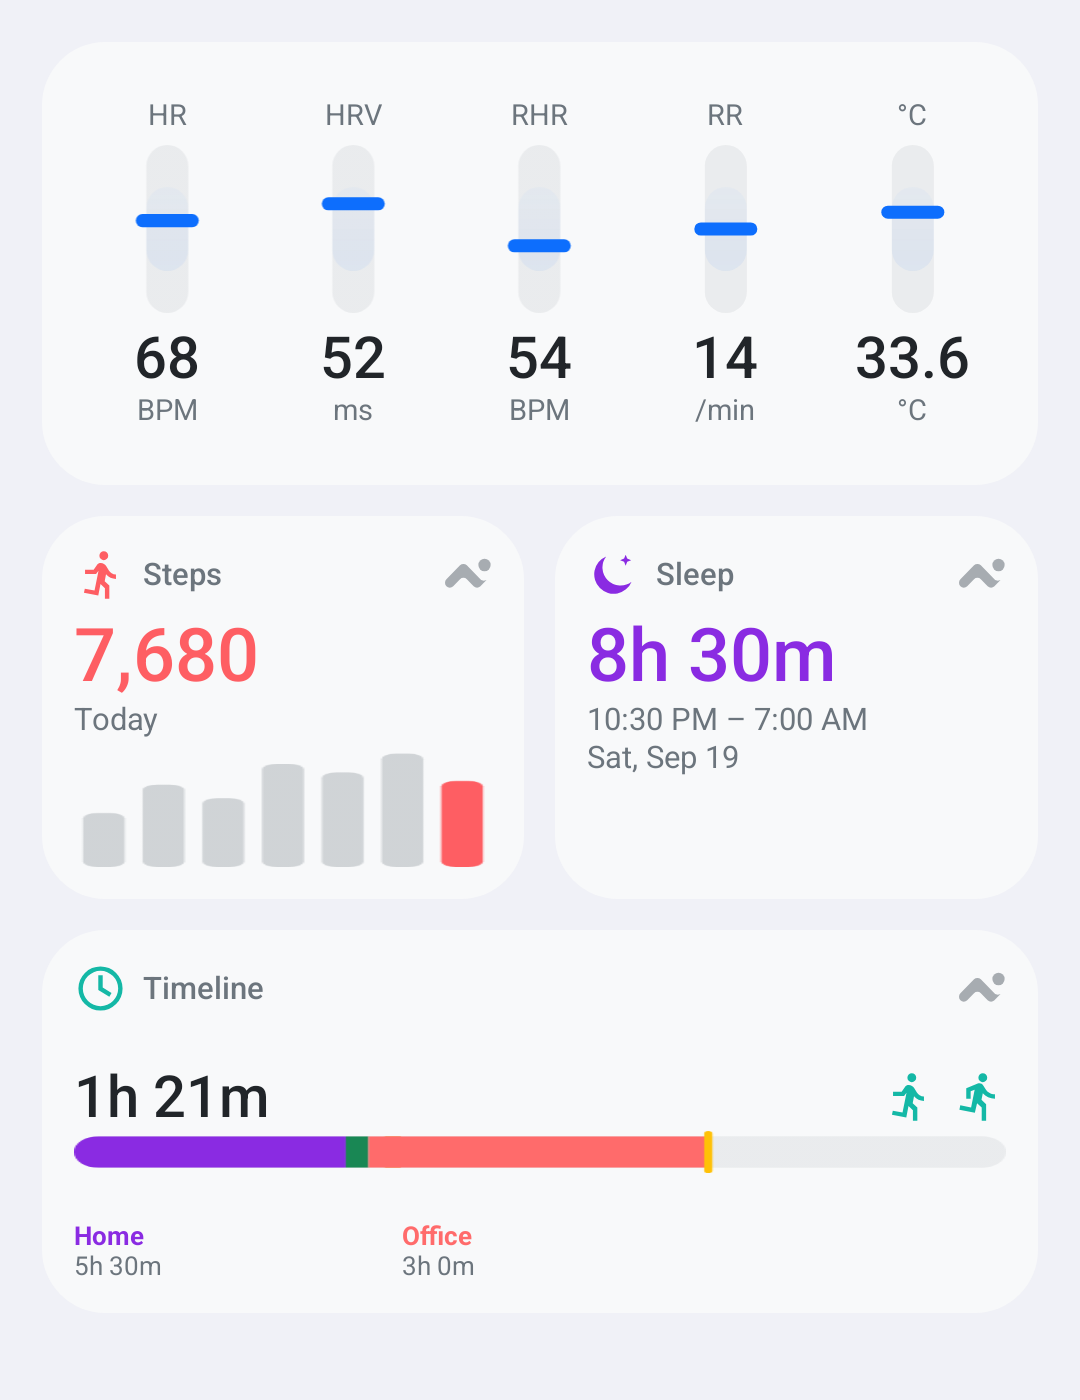
Check sleep, steps and your daily timeline without opening the app. Our new Android widgets put them on your home screen. Inside Aidlab, health views now include sleep position and skin temperature.
Aidlab now requires Android 12 or newer. We also improved app startup and Bluetooth permission handling, added support for iOS 27, and added the option to save RMSSD to the Health app on supported devices.
Dashboard
EDF exports that keep the recording intact
EDF exports can now include all three accelerometer axes alongside the recorded signals. Longer downloads preserve real gaps and split discontinuous recordings into separate files, while short ECG interruptions remain interpolated, giving analysis tools a more faithful timeline.
Aidlab SDK 2.5.6 makes device communication more reliable when collecting data, syncing or disconnecting. It also fixes stationary activity being reported as unknown. This update includes the recent improvements to iOS integration through Swift Package Manager.
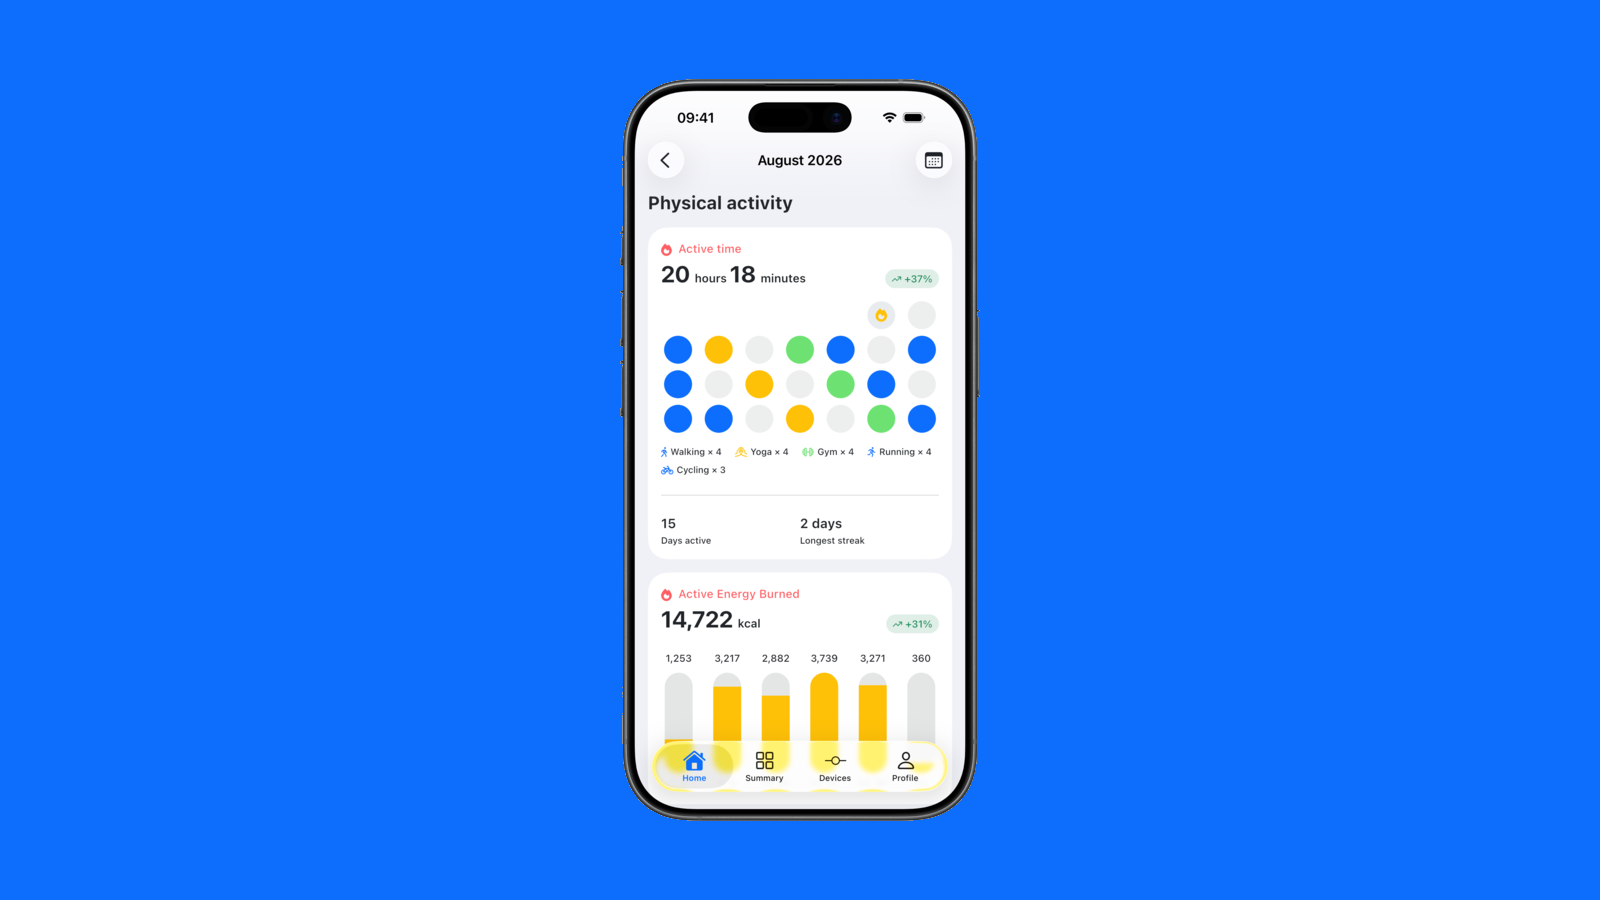
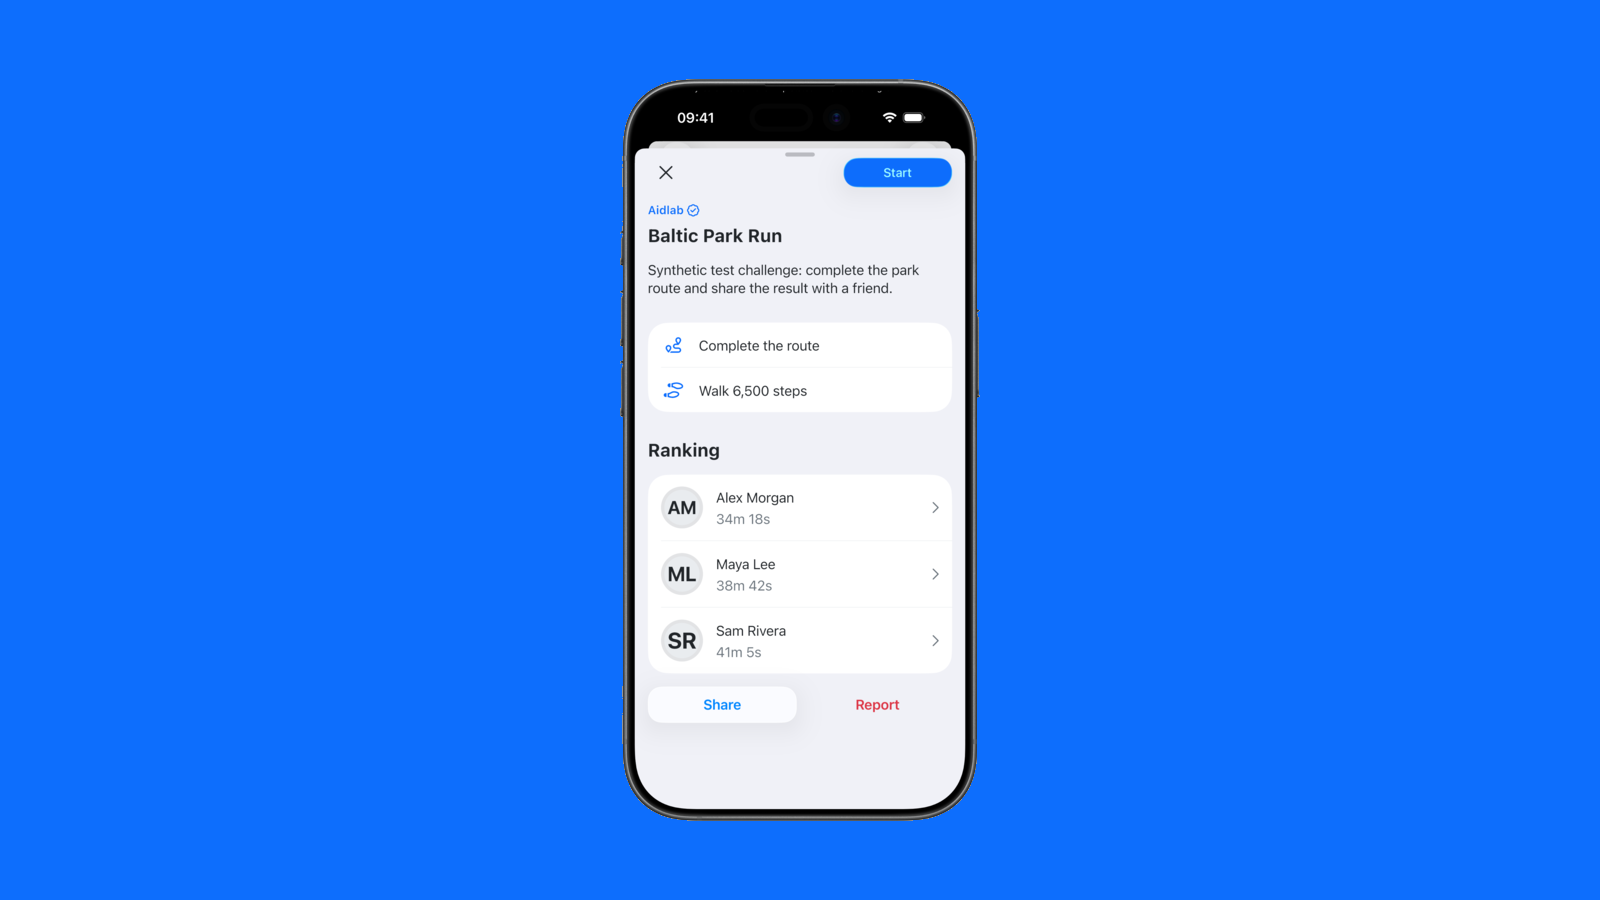
Activity, recovery, heart rate and sleep now come together in your monthly summary. See how recent weeks compare, then invite someone to a Challenge and follow your results on the same route.
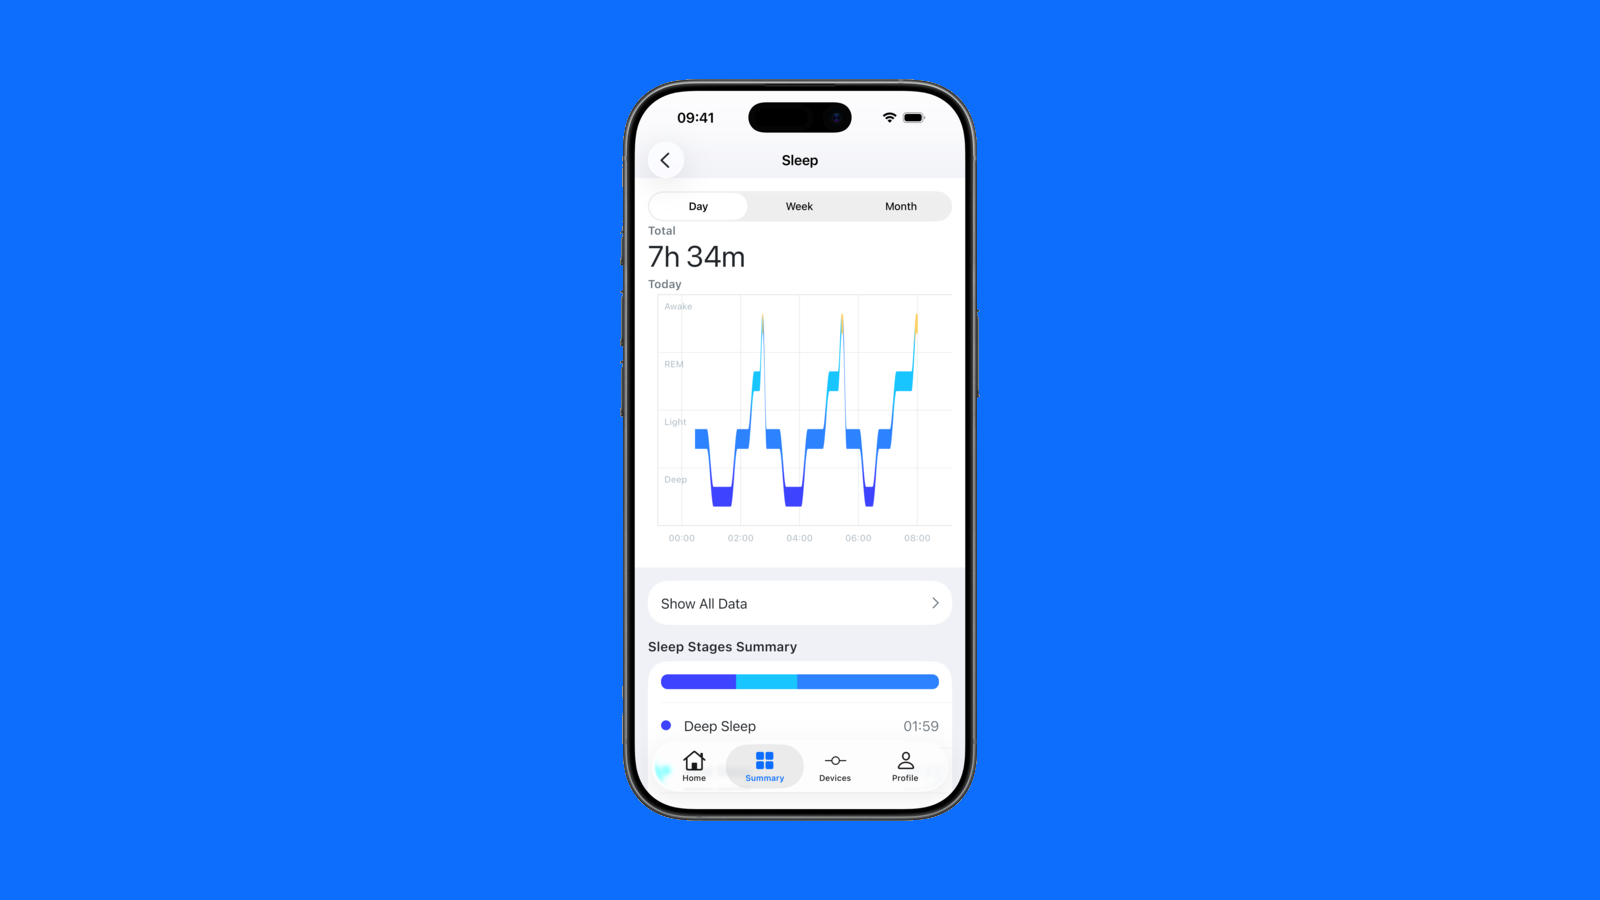
Sleep stages are easier to follow, moving between dates is more convenient, and data synchronization is more reliable. Live sleep analysis now stays resilient through short signal gaps, while updated ECG analysis and in-app strap-fit guidance help keep recorded data dependable.
Aidlab
An easier way to review ECG
Updated beat classification makes ECG recordings easier to review. We've also improved individual reports and checks for poor-quality signals.
API
Ask AI about your Aidlab data
Connect Aidlab to an AI client through MCP, then ask about your steps, heart rate, HRV or sleep. You choose whether to grant access. The connection is read-only.
The Activities section is now Challenges. We redesigned the map and added filters by activity type, difficulty, and whether Aidlab is required. Goals are clearer, and completed Challenges now include attempt history, personal bests, and ranking details.
SDK
One Unity SDK API across platforms
Refreshed the Aidlab Unity SDK 2.5.0 package with one Aidlab.AidlabSDK API across Android, iOS, macOS, and Windows. The obsolete Android-only Aidlab and IAidlab entry points are gone, while the corrected Windows BLE bridge exports ReadData and SetWriteWithoutResponse as required by the packaged C# API.
Dashboard
Clearer handling of incomplete data
Dashboard charts now clearly flag partially available data instead of presenting incomplete results as final. Date ranges and reports also handle boundary times more consistently, helping keep summaries accurate.
Mobile app
Health sync and workout reliability
Aidlab now handles Apple Health permissions and temporarily unavailable health data more reliably, recovers syncing when an internet connection returns, and keeps background device collection and reconnects steadier. Workout pace ranges, local cache clearing, and manually added or edited workouts are also clearer.
SDK
Aidlab SDK 2.5.0
Released Aidlab SDK 2.5.0 with deterministic command results across platform wrappers. The Unity download now ships current Android, iOS, macOS, and Windows integrations together with Unity 6-compatible examples and documentation.
Mobile app
ECG analysis after interrupted recordings
ECG analysis in the Aidlab app was updated with a newer model and stronger safeguards around post-pause ectopy detection, reducing false rhythm flags after interrupted or noisy ECG segments.
Mobile app
Detailed workout review
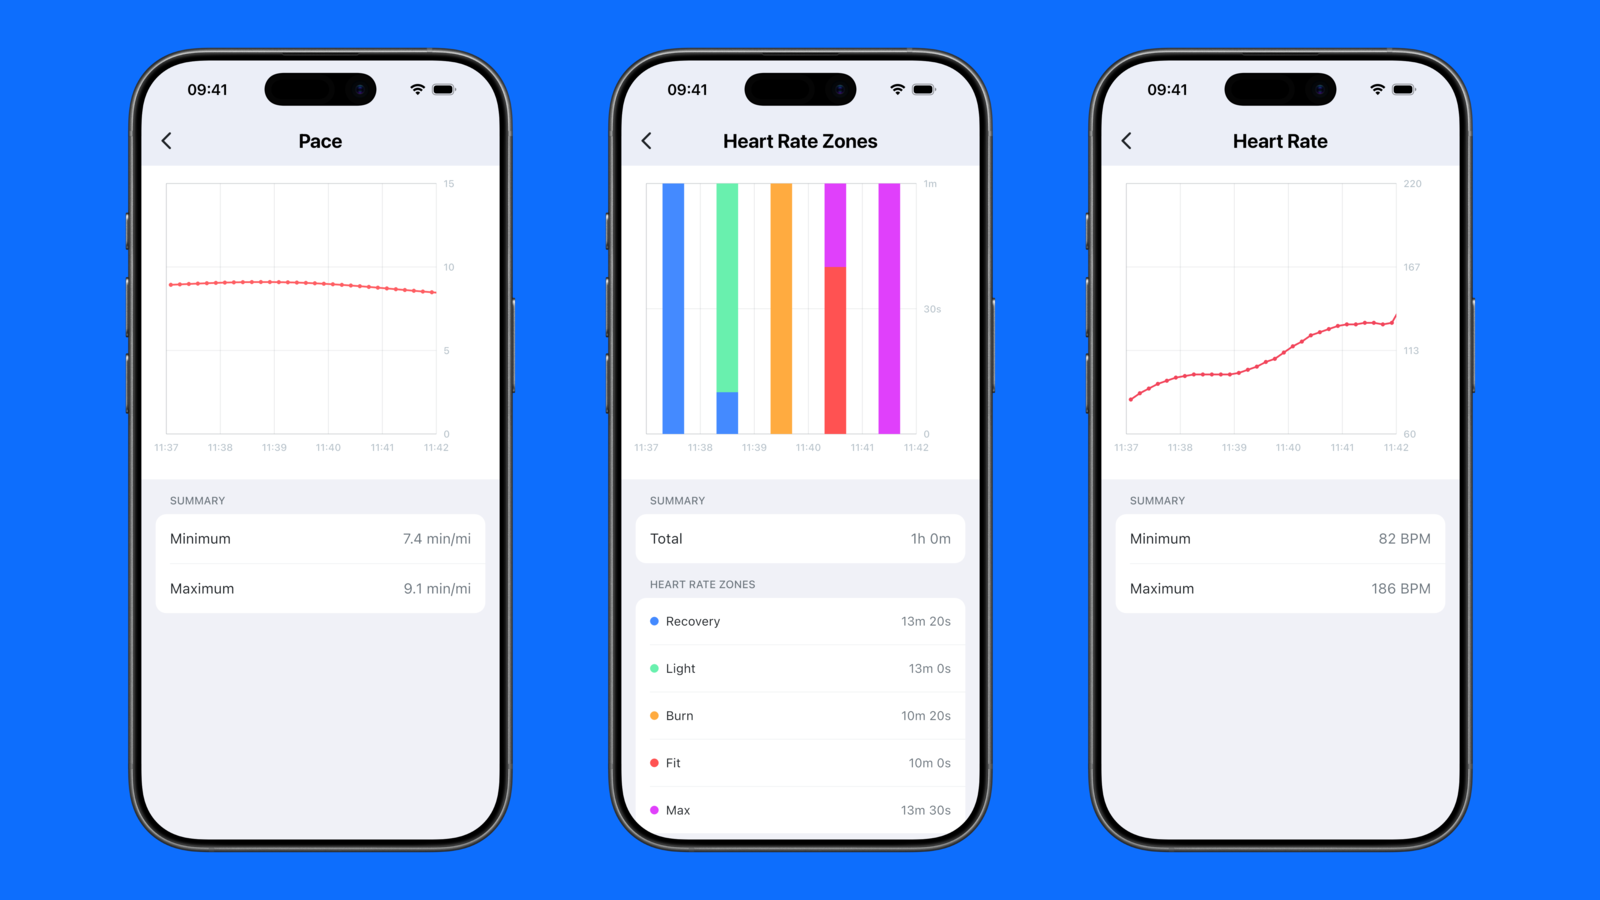
Workout review is more detailed in the Aidlab app. Recent sessions are easier to revisit, workout components now open into focused detail charts, ECG reports can be read from local sessions, and pause/resume workout alerts are clearer.
Dashboard
Precise date filters and report history
Dashboard review got more precise date filtering with time selection, and Aidmed report creation now keeps program-history context more reliably when configuring reports.
SDK
Aidlab SDK 2.4.0
Released Aidlab SDK 2.4.0 with clearer cross-platform error codes and refreshed Flutter, Python, Unity, Android, and Apple bindings for integrators.
Mobile app
Timeline and tracking fixes
Sleep timelines, stacked charts, steps, pedometer behavior, background tracking, and dark-mode component editing received another round of stability and usability fixes.
Mobile app
Pause and resume workouts
Aidlab app now supports pausing and resuming workouts, sleep and health sync are more complete, with arousal-aware sleep staging. Health history and workout review are easier to inspect with an infinite history chart, more stable route maps, and corrected pace and elevation-gain analysis.
Dashboard
More reliable PDF pagination
Dashboard reports now paginate component PDFs more reliably.
Mobile app
Health history stored on your phone
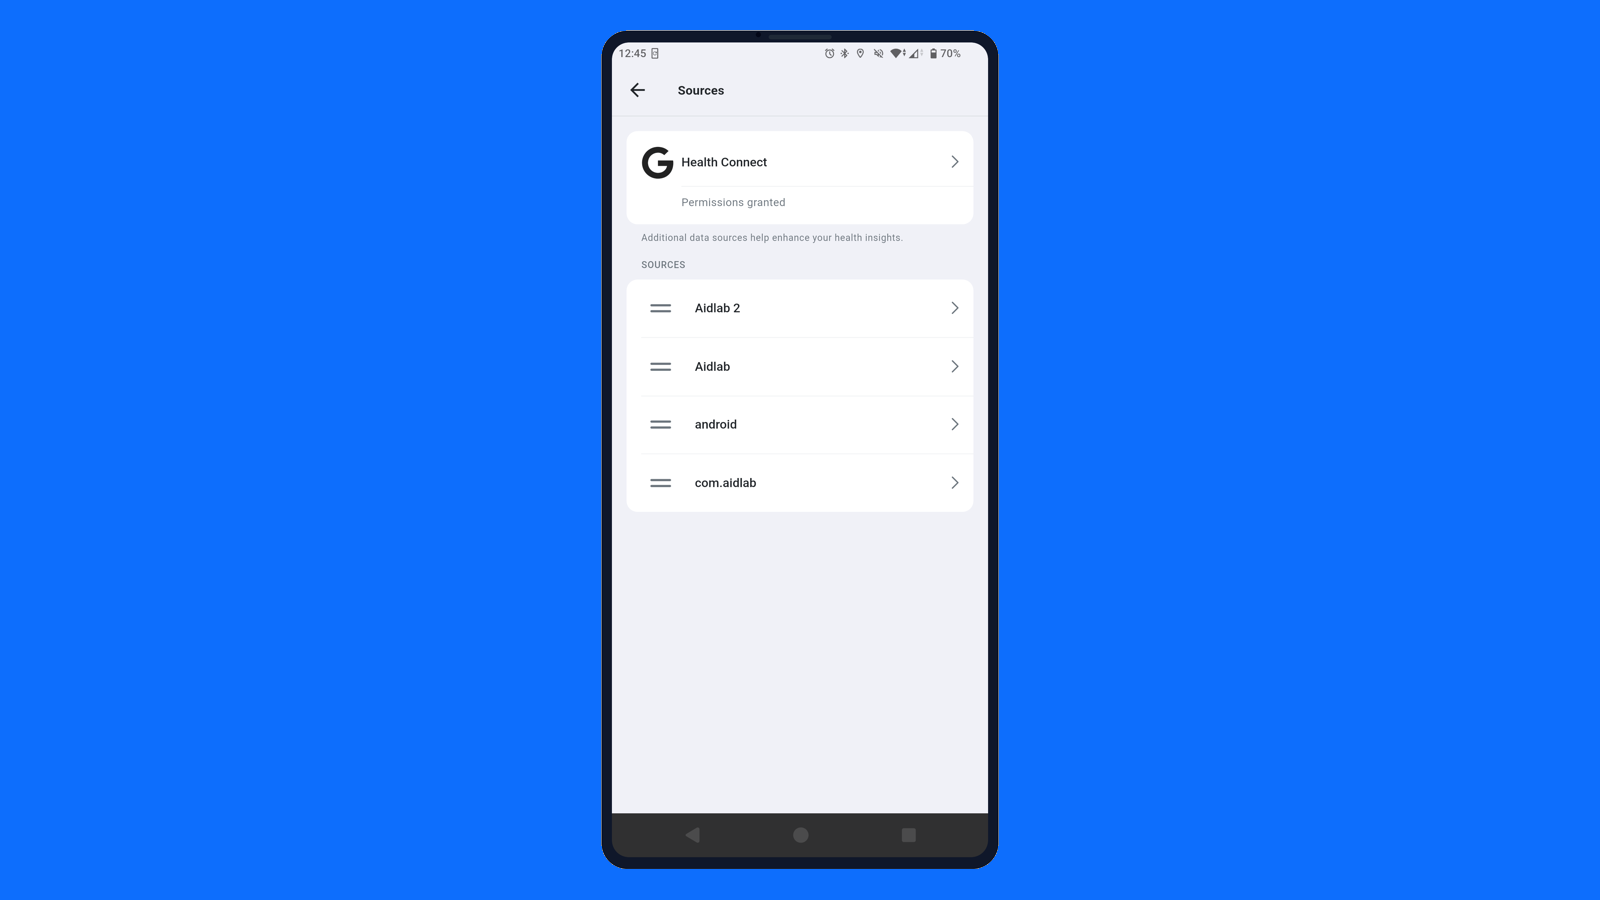
May is about making Aidlab feel less dependent on the cloud for everyday use. More of your health history now lives directly on the phone, so timelines and charts can load faster, keep working when the connection is weak, and restore more reliably after login. We also cleaned up how Aidlab understands data sources, which means fewer duplicates and clearer separation between records from Aidlab, Health Connect, and other synced sources.
Aidlab
Heart-rate filtering during movement
Aidlab is now more restrictive about heart-rate signal quality. Short bursts of noise are ignored more aggressively, especially when the strap shifts for a moment, for example when you bend down to pick something up, adjust your shirt, tighten the chest strap, or change position during a workout. The goal is simple: keep the heart-rate trend cleaner and avoid treating movement artifacts as real physiology.
Dashboard
Clearer measurement sources
The dashboard now has a cleaner picture of where health data came from. Imported heart-rate, location, RR interval, body-position, and other measurements preserve better source information and clearer source names. We also fixed edge cases around zero-value measurements, so charts and reports stay more accurate when synced data contains legitimate zeros.
Dashboard
More flexible programs and reports
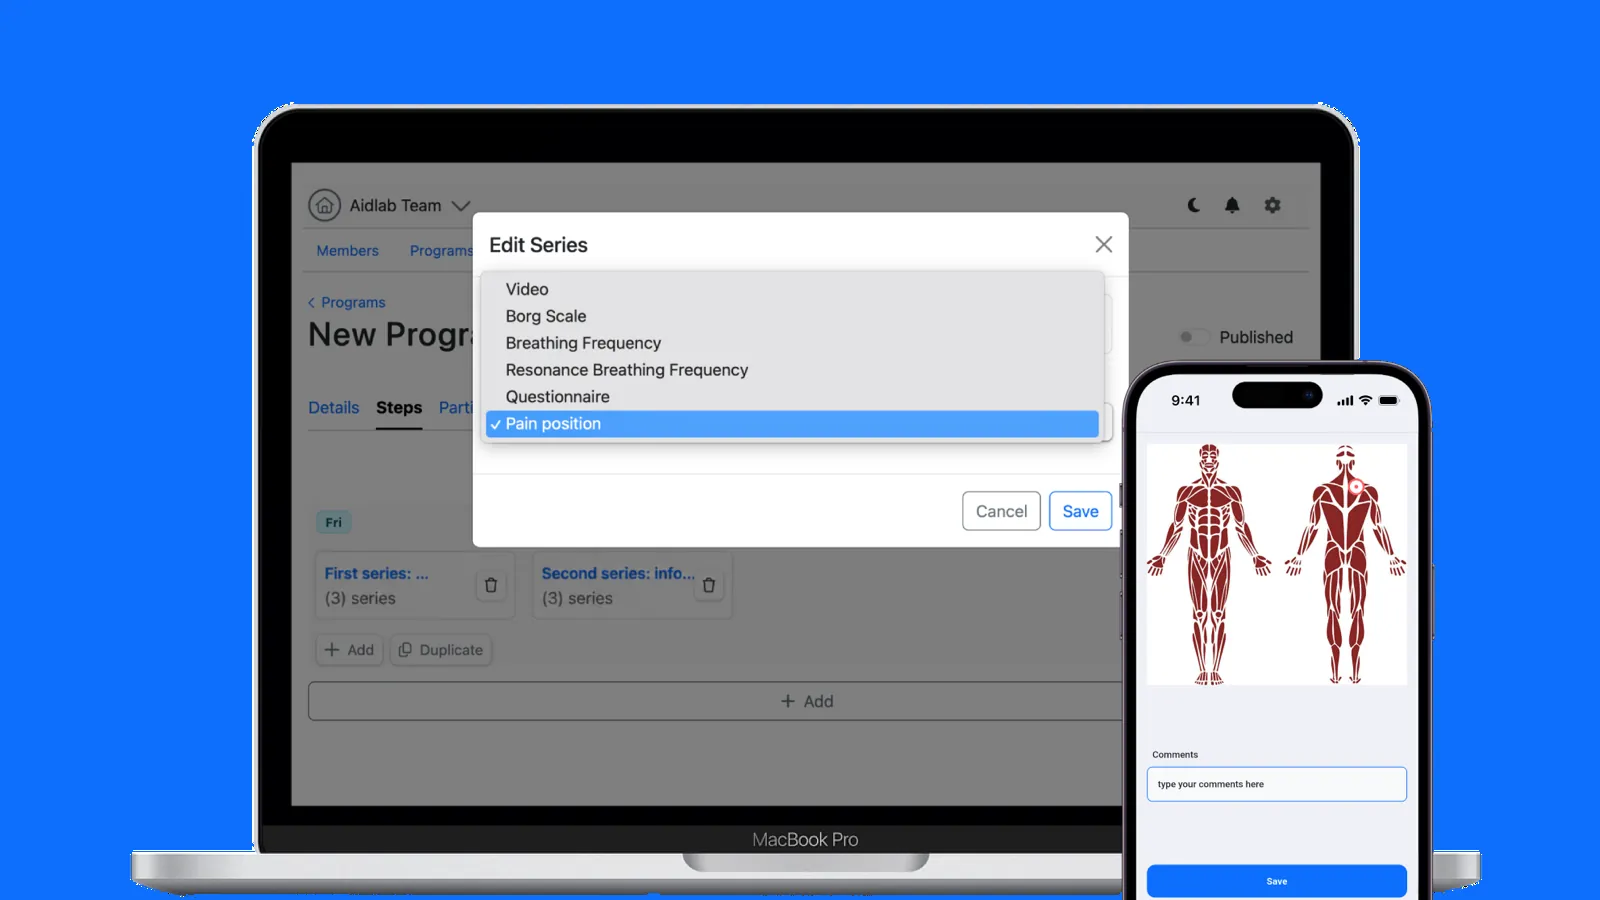
April focused on making clinical workflows smoother and reports easier to trust. Programs now support duplicated days and pain-type selection, so teams can build rehab and monitoring plans with more context instead of forcing everything into one generic track. Reports and charts also got more consistent units, better pagination, corrected histogram bins, and more reliable recent-data windows.
Mobile app
ECG and sleep analysis safeguards
ECG and sleep analysis became more conservative where it matters. The app now uses stronger rhythm safeguards and updated signal handling to reduce noisy post-exercise ECG interpretations, while pairing handles device selection more reliably. Sleep summaries also include an extra wake-time safeguard, helping nights with borderline wake patterns land in a cleaner final summary.
Mobile app
Health Connect and background tracking
March improved the whole mobile tracking flow: Android now supports a much broader Health Connect sync, Apple Health workout updates on iOS land more smoothly, Android ongoing workouts can stay visible in a live notification, push and shared-link routing is more reliable after login, and sleep tracking handles short interruptions more gracefully. We also fixed background-sync crashes, strengthened Bluetooth handling, reduced battery impact from background location tracking, and cleaned up workout sharing and locale-aware formatting.
Dashboard
Report filtering and activity metrics
Dashboard analysis and reporting became more consistent thanks to fixes in workout and event filtering, timeline range handling, and ANS balance calculations. We also added cycling distance and floors climbed, with clearer insight summaries on top.
Firmware
More consistent heart-rate data
We improved consistency of heart-rate data in Aidlab by refining packet timing and smoothing behavior.
SDK
Aidlab SDK 2.3.0
Released Aidlab SDK 2.3.0 with cross-platform SDK unification and updated Flutter SDK support for integrators.
Mobile app
Daytime sleep and Apple Health metrics
We added a Day Sleep chart so naps are finally visible and easy to compare with nighttime sleep. Apple Health sync now also supports more metrics (HR, RHR, SpO2, VO2max, respiration rate, blood glucose) for deeper iOS integration.
Dashboard
Program search and completion notifications
Program search and end-of-program notifications were improved for a smoother clinical workflow.
SDK
Aidlab SDK 2.1.5 for Windows
Aidlab SDK 2.1.5 includes improvements to device connectivity on Windows.
Firmware
Recorded session timestamps
Date/time handling was corrected in Aidlab, reducing timeline inconsistencies in recorded sessions.
Mobile app
Timezone and workout tracking fixes
Fixed timezone/DST issues in charts and improved workout tracking stability (route map + elevation), plus several upgrade and crash fixes.